Bollinger bands are a technical indicator that traders can use in various ways to help traders achieve success. We’ll discuss four ways traders can use Bollinger bands to improve their trading results. We will also provide examples to help illustrate how these techniques work. We hope you find this information helpful.
What are Bollinger bands, and how are they used in trading
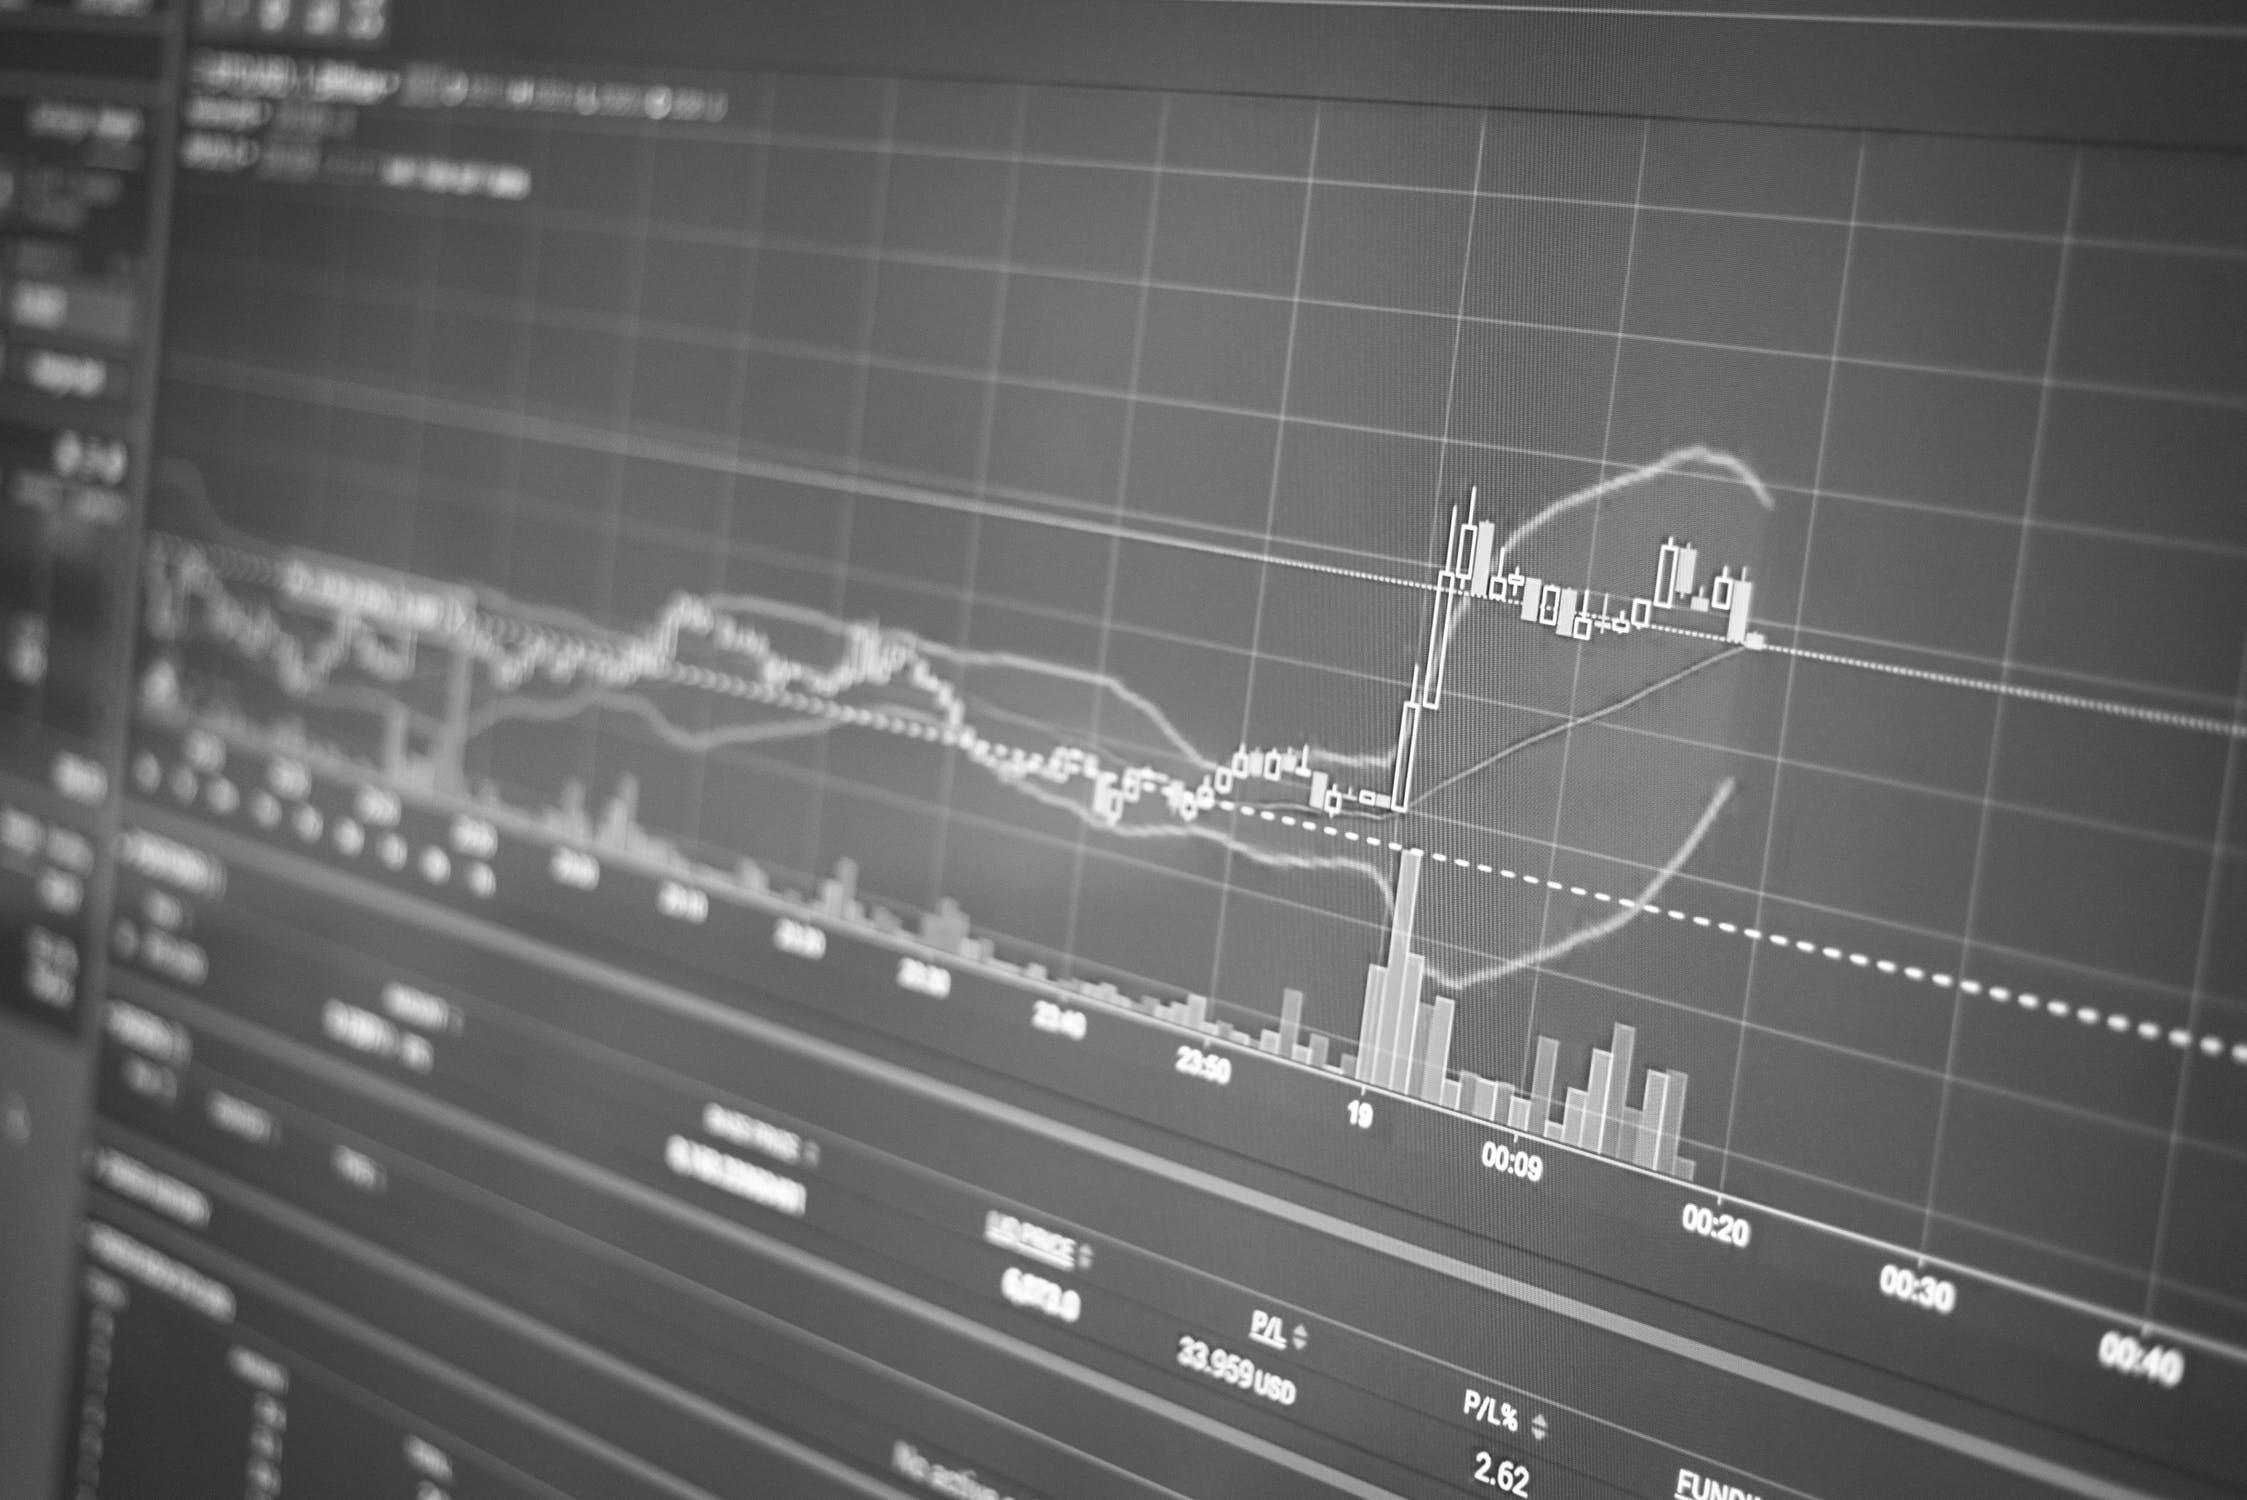
Bollinger bands are a technical indicator that traders use to measure market volatility. The bands are created by drawing two lines on a chart: one line represents the upper Bollinger band, and the other line represents the lower Bollinger band. The space between the two lines is the ‘bandwidth’. The bandwidth’s width indicates market volatility: the more comprehensive the bandwidth, the more volatile the market.
Traders use Bollinger bands to identify high and low volatility periods and trade accordingly. For example, traders may buy during periods of high volatility when prices touch the lower Bollinger band in anticipation of a rebound. Conversely, during periods of low volatility, traders may sell when prices touch the upper Bollinger band in anticipation of a retreat. Traders can use Bollinger bands on any chart and within any timeframe.
Different ways traders can use Bollinger bands
Bollinger bands are a technical analysis tool used by traders to measure volatility. The bands are composed of three lines: an upper line, a lower line, and a middle line. The middle line is typically a simple moving average, while the upper and lower lines are two standard deviations away from the middle line. Traders can use it in several ways, but one common way is to use them to identify overbought and oversold conditions.
When the price is close to the upper Bollinger band, it is considered overbought, and when the price is near the lower Bollinger band, it is considered to be oversold. Traders often look for buy or sell signals when the price is in these extreme conditions. Traders can also use Bollinger bands to identify trends. When the price is consistently above the middle Bollinger band, it indicates an uptrend, and when the price is consistently below the middle Bollinger band, it indicates a downtrend. Traders can use this information to make informed trading decisions.
Finally, traders use Bollinger bands to set stop-loss orders. By placing a stop-loss order at the upper or lower Bollinger band, traders can protect their profits and limit losses.
Example of how traders can use Bollinger bands
Traders use Bollinger bands in several ways, but one common way is to identify overbought and oversold conditions. For example, let’s say you are looking at a chart of XYZ stock with an a20-day moving average. The upper Bollinger band is currently at $30, and the lower Bollinger band is currently at $20. The stock is overbought when it trades above $30 and oversells when it trades below $20.
As a trader, you would look for opportunities to buy when the stock is oversold and to sell when the stock is overbought. Traders can use Bollinger bands used to set stop-loss orders. For example, if you bought XYZ stock at $25, you could place a stop-loss order at the lower Bollinger band of $20. It would protect your profits and limit your losses.
Final thoughts on the usefulness of Bollinger bands in trading
Bollinger bands have become a popular tool among traders in recent years. While there is no perfect indicator, Bollinger bands can provide valuable information about potential price movements. By observing the width of the bands, traders can see whether the market is currently overbought or oversold.
Additionally, traders use Bollinger bands to confirm other technical indicators. For example, if the price tests the upper Bollinger band and RSI indicates overbought conditions, this may be a bearish signal. Bollinger bands can be a helpful addition to any trader’s toolkit and are not too hard to master with a little effort.


